Endpoint Management Analytics
A single analytics surface for a managed device fleet — compliance, update rings, configuration drift and app health, built from Microsoft Graph and refreshed on a schedule.
Rebuilt on synthetic data — figures illustrative
Overview
Device-management data lived in a dozen places: the Intune admin center, ad-hoc CSV exports, a handful of PowerShell scripts, and separate spreadsheets for update rings and compliance. Answering a simple question — "how healthy is the fleet this week?" — meant stitching those sources together by hand, and the answer was stale by the time it was assembled.
Objective
Replace the manual stitching with one analytics surface that a workplace engineer or a manager can open and trust: current compliance, update-ring coverage and progress, configuration drift, and app-install health, all on the same refresh cadence and all traceable back to the device.
Approach
A PowerShell job runs on a schedule, authenticates to Microsoft Graph as an app registration, and pages through the device, compliance-state, configuration-profile and app-assignment endpoints, writing each to CSV. Power Query normalises those extracts — typing columns, splitting OS build strings, collapsing the per-setting compliance rows to one state per device, and appending the current pull to a weekly snapshot table so history accrues without storing every day.
The model is a star schema: a device dimension keyed on the Entra device ID, small Platform and Update Ring dimensions, and fact tables for compliance snapshots, feature-update state, configuration drift and app results. DAX measures carry the logic — compliance rate, week-over-week and vs-baseline deltas off the snapshot table, ring coverage roll-ups, and drift/error rates per profile. Every visual drills through to the device list behind it, so a headline number is never a dead end.
Solution
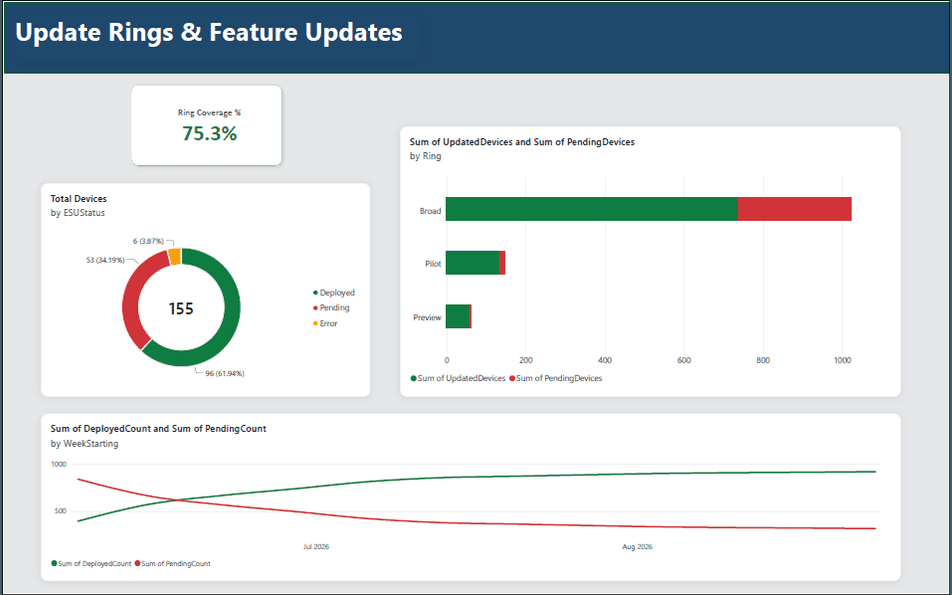
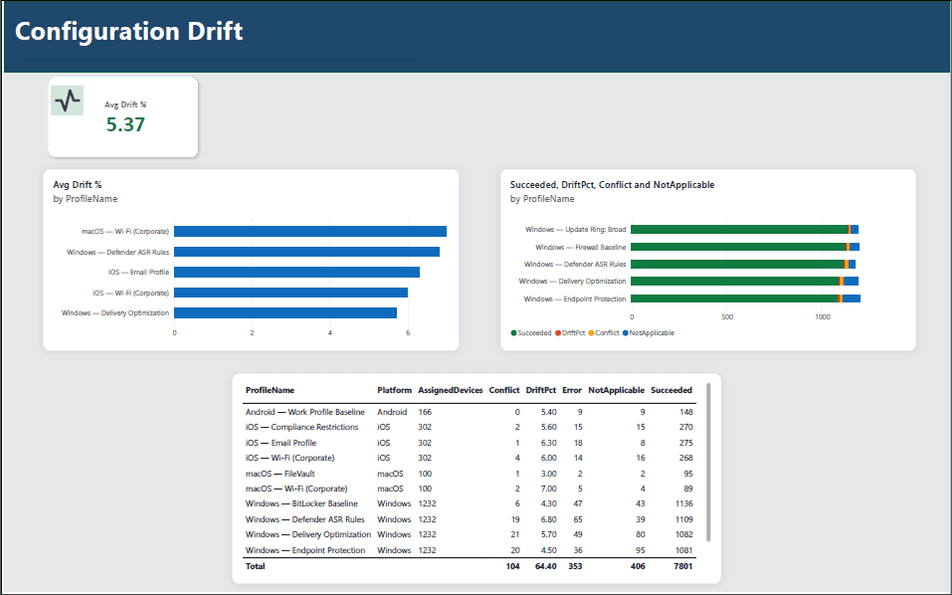
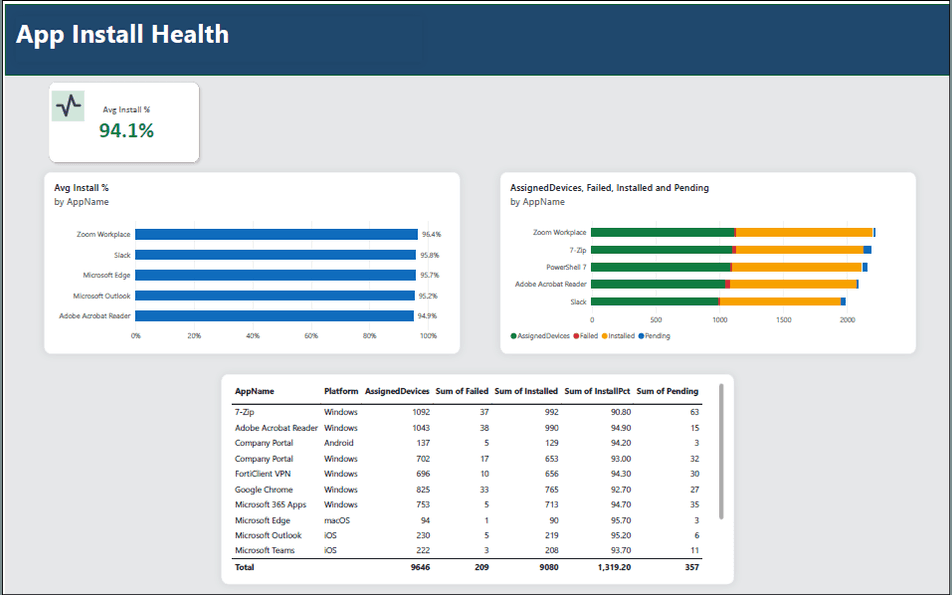
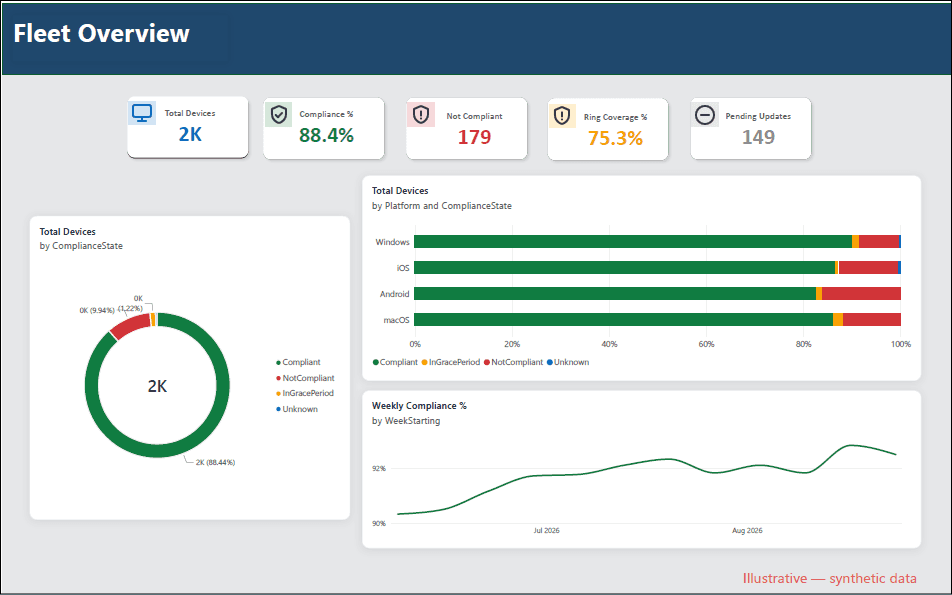
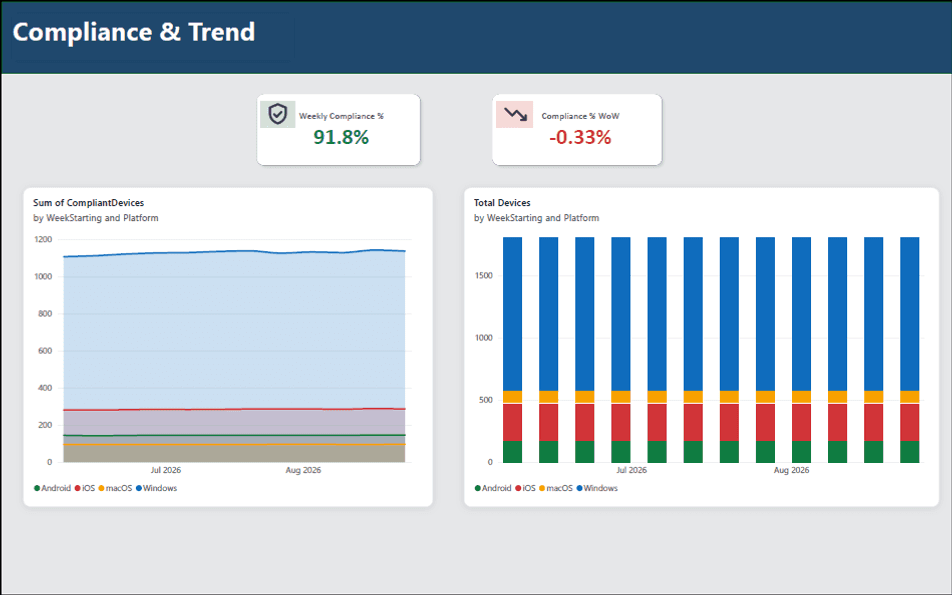
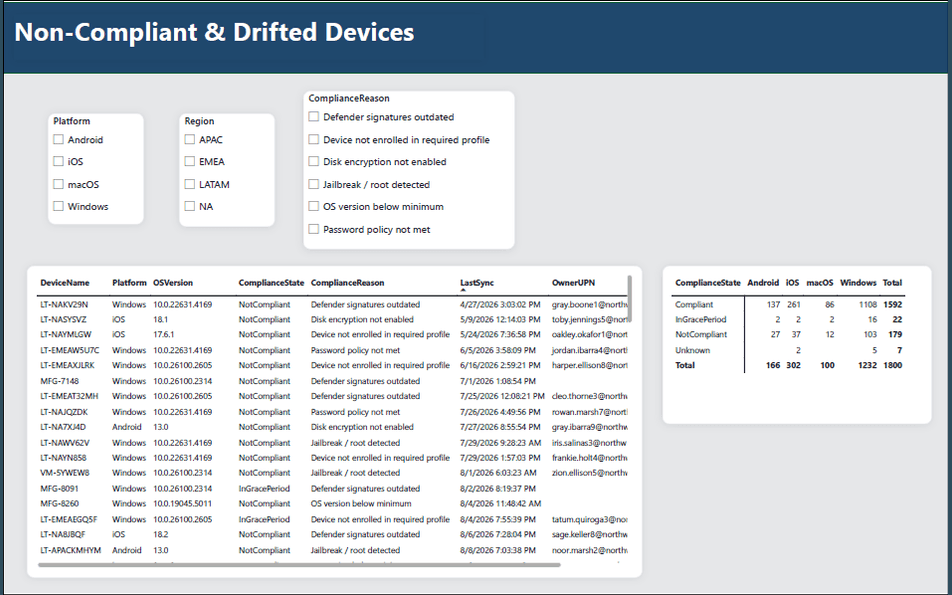
Six pages, one rhythm. A fleet overview leads with headline compliance, ring coverage and a rising weekly trend line; a compliance page breaks that trend down per platform; a device page lists every non-compliant or in-grace machine with the exact setting at fault and its last check-in. Three more pages cover update-ring rollout against a target build, configuration-profile drift ranked worst-first, and app-install health per application. Remediation starts from the report — the device page is a worklist, not a summary.
Every figure shown is synthetic. In this build the fleet runs around 88% compliant across roughly 1,800 devices, climbing from about 90% to 93% over two months, with macOS and Android trailing Windows and iOS by a few points; ring coverage sits near 75% mid-rollout and app installs around 94%. They're there to show the shape of the surface, not to stand in for real numbers.
Technology
- Power BI
- DAX
- Power Query
- Data Modeling
- Microsoft Intune
- Microsoft Graph
- PowerShell
Outcome
What exists today is the full report end to end — the star-schema model, every DAX measure, and all six pages with working drill-throughs — built and verified against the synthetic dataset shown here. The pattern is what would point at a real fleet's Graph data with no structural changes: swap the synthetic CSVs for the real extraction output, and the same model, measures and pages carry it.
Gallery