Intune Compliance Dashboard
Cross-platform device-compliance monitoring built from Microsoft Graph exports, with a weekly trend view across Windows, iOS/iPadOS, macOS and Android.
Rebuilt on synthetic data — figures illustrative
Overview
Two questions kept coming up about the managed fleet: what's compliant right now, and is that number moving in the right direction. There wasn't one place that answered both — current state lived in the Intune admin center's per-device blade, and trend meant re-running the same export and comparing it to last week's by hand.
Objective
Build a compact, two-page compliance surface: a current-state view broken down by platform and ownership, and a trend view showing whether compliance is improving or slipping, on the same weekly refresh cadence.
Approach
A PowerShell job pulls device compliance state from Microsoft Graph on a schedule and writes it to CSV. A device-grain table carries platform, ownership type (company / personal / unknown) and compliance label; a weekly snapshot table appends one row per device per week so the trend page has history to read instead of re-deriving it from raw state each time. Power BI's own filter visuals handle the platform and ownership breakdown, keeping the model to one fact table, two small dimensions, and a handful of DAX measures for the rolled-up compliance rate and its week-over-week and vs-first-monitored deltas.
Solution
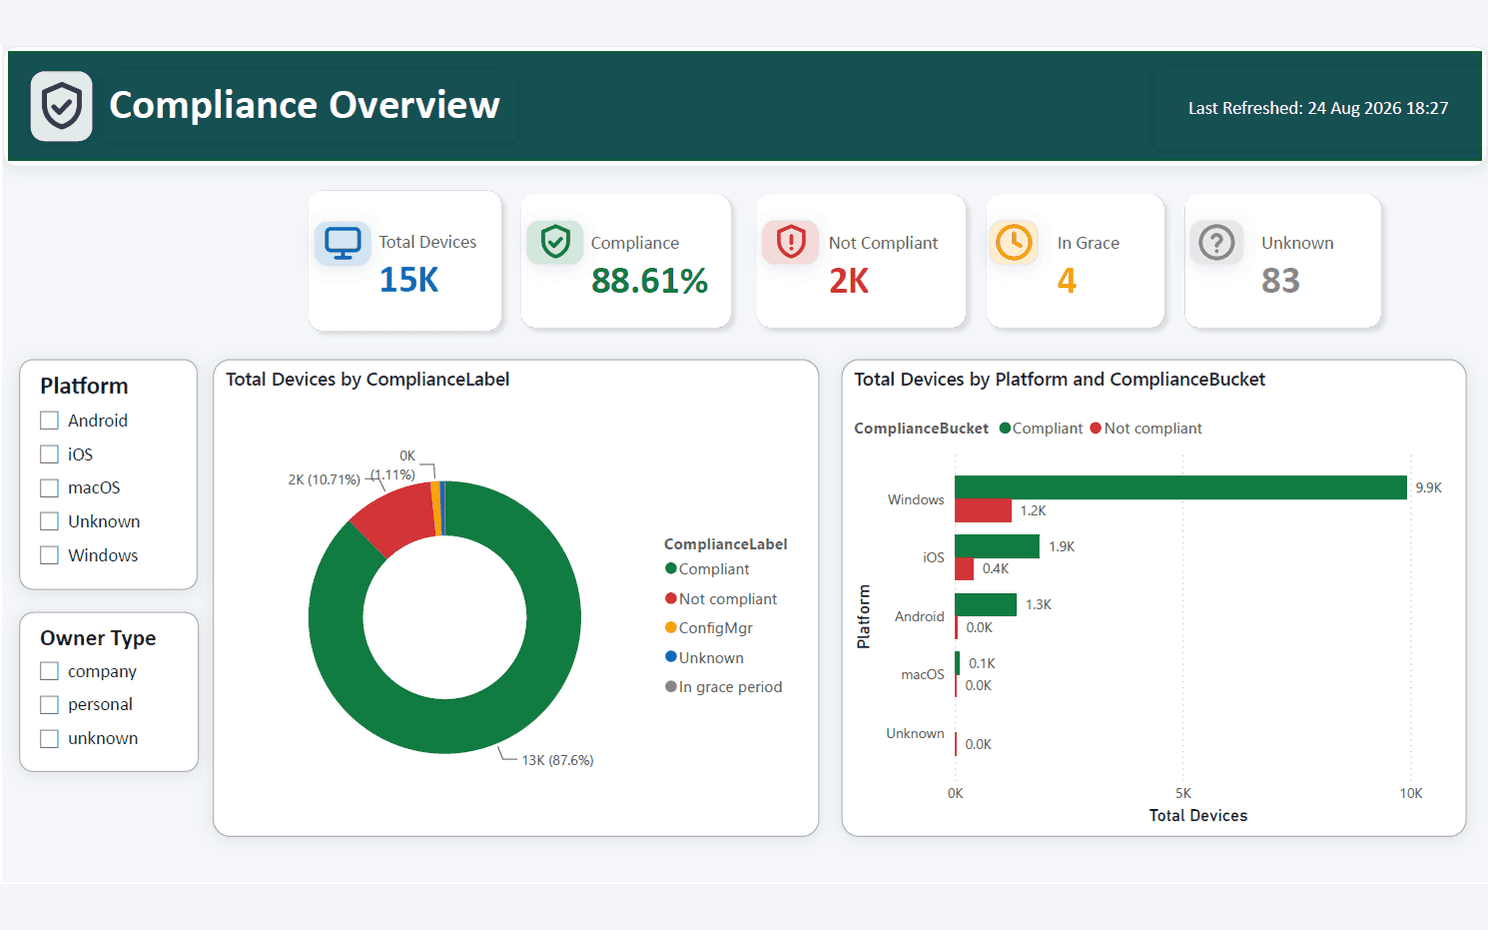
The Overview page leads with five KPI cards — total devices, overall compliance rate, non-compliant count, devices in grace period, and devices with an unknown state — then breaks total devices down two ways: by compliance label in a donut, and by platform and compliance bucket in a bar chart, so a Windows-heavy fleet's numbers aren't hidden behind one aggregate percentage. Platform and Owner Type filters narrow both charts to a segment.
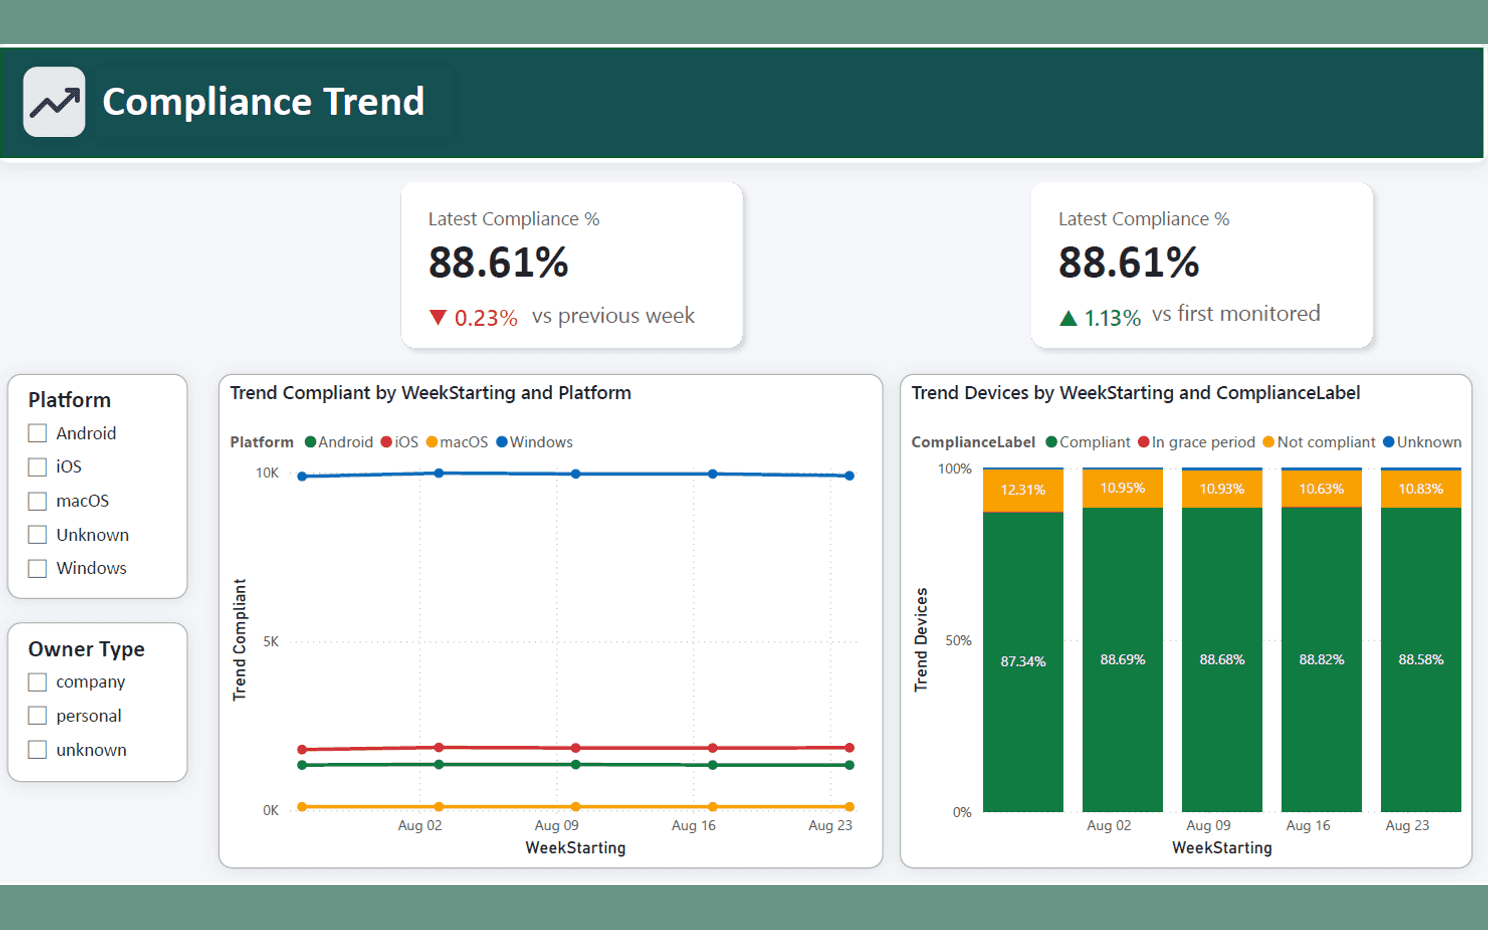
The Trend page repeats the headline compliance rate alongside two deltas — against the previous week and against the first monitored week — then plots several weeks of compliant-device counts per platform as a line chart, and the same weeks as a 100%-stacked bar broken out by compliance label, so a small rate change reads as a shape change in the bars, not just a number.
Every figure shown is synthetic. In this build overall compliance sits around 89% across roughly 15,000 devices, down slightly week over week but up against the first monitored week — illustrative only, not a real fleet's numbers.
Technology
- Power BI
- DAX
- Microsoft Graph
- PowerShell
- CSV model
Outcome
Both pages work end to end against the synthetic dataset shown here — the weekly snapshot table, the DAX deltas, and the platform/ownership breakdown all behave exactly as described. Pointed at a real Graph export instead of the synthetic CSVs, nothing about the model or the report changes — only the numbers would.